At around midnight on 8 August 2010, local time, a sudden heavy rain fell in the mountain area northeast of Zhouqu, Gansu Province trigged a massive debris-flow event in the Sanyanyu and Luojiayu gullies. The debris flow was about 5000 m long, 300 m wide, averaged 5 m thick, and led to 1492 deaths and 272 missing persons. It then flooded into the Bailongjiang River, jamming it to form a barrier lake, which flooded 1/3 of the area of the whole city, destroyed 233.4 acres of farmland, and damaged 5508 rooms (according to the Ministry of Civil Affairs).
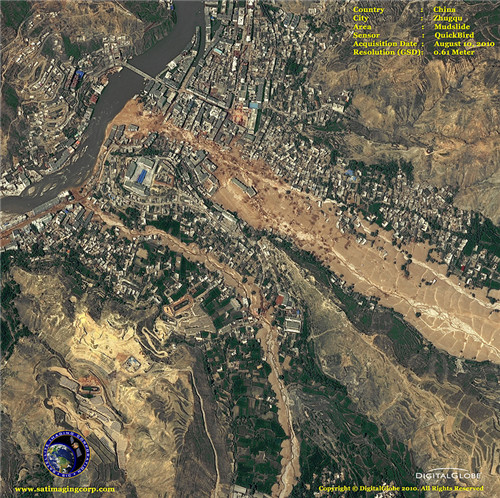
Figure 1 A Quickbird satellite image of Zhouqu Debris-flow (from www.satimagingcorp.com)
Field investigations and remote sensing images suggested that the debris flows were formed by upstream flooding, and the flash flood was triggered by a severe convective weather process with heavy rainfall. However, because of the challenging terrain of the region, there are few routine weather stations (gauges) and the visual angle and data coverage of radar is limited. Fortunately, satellites cover almost all of Earth’s surface. Furthermore, numerical weather models can also offer coverage for mountainous areas, and, moreover, can provide real-time quantitative precipitation forecasts.
Scientists from Institute of Atmospheric Physics and University of Oklahoma validated the qualities of both satellite-derived and numerical weather model–forecasted rainfall during this debris-flow event in Zhouqu. They found all products show the basic pattern feature that it rains heavily in the middle and northwest part of this domain (mountains), while it rains little in the southeast part (plains), and all products show similar scales and ranges of accumulated rainfall. Figure 2 shows the accumulated rainfall over 96h of the different products in their original spatial resolution.

Figure 2. Accumulated rainfall of domain 03 in Figure 1 from 0000 UTC 6 August 2010 to 2300 UTC 9 August 2010 for each rainfall product at their original spatial resolutions. Note: The gauge data were interpolated to a 0.25° longitude × 0.25° latitude grid using Cressman object analysis. (Figure plotted by IAP)
The Taylor diagram (Fig. 3) shows that the RMSEs and correlation coefficients of the remote sensing data are smaller than the WRF-forecasted data. It also shows that the correlation coefficients of CMORPH and TRMM are higher than for PERSIANN; however, the standard deviations are also higher than for PERSIANN. In order to compare the performances of all the products in different periods of the lifespan of the rainfall, maximum rainfall within the research domain at each time step is plotted in Figure 4. In general, results of remote sensing data are better than numerical forecast; for remote sensing data, the results of microwave remote sensing are better than the infrared; higher resolution data are more accurate than lower resolution data.
It’s therefore concluded that both satellite remote estimated and numerical weather model forecasted rainfall can basically reproduce the spatial pattern and temporal variance of extreme rainfall. They can both basically meet the demands of landslide and debris-flow numerical forecasts.
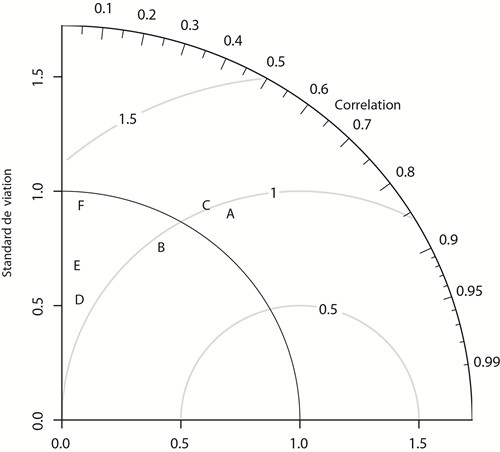
Figure 3. Taylor diagram comparing the six-hourly precipitation of each product: (A) CMORPH; (B) PERSIANN; (C) TRMM; (D) WRF d01; (E) WRF d02; and (F) WRF d03. (Figure plotted by IAP)
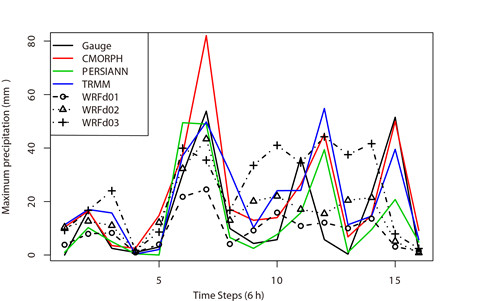
Figure 4. Time series of maximum rainfall in domain 03 of each rainfall product. Note: All data were regridded. (Figure plotted by IAP)
References
Wang, J., H.-J. Wang, and Y. Hong. 2016. “Comparison of satellite-estimated and model-forecasted rainfall data during a deadly debris-flow event in Zhouqu, Northwest China.” Atmospheric and Oceanic Science Letters 9: 139–145.
Contact: WANG Jun, wangjun@mail.iap.ac.cn