A new method to assess long-term trend in the ocean heat content
Date:2014-10-14
Due to the release of carbon dioxide, the global energy equilibrium has been altered, and the amount of stored heat has increased, causing global warming to occur since the industrial revolution. Due to its large heat capacity, the ocean stores ~90% of global warming energy and acts as the major heat reservoir for the climate system. Therefore, it is an important task to estimate historical ocean heat content (OHC) change.
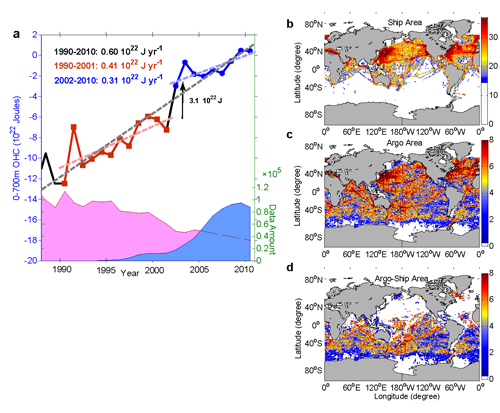
Recent OHC calculations have shown a dramatic shift during the period 2001–2003, which is nearly coincident with a major transition in the ocean observation network from a ship-based system to Argo floats. CHENG Lijing and ZHU Jiang from Institute of Atmospheric Physics, Chinese Academy of Sciences showed that Ship-based system pre-2001 mainly sampled the ocean near the main cruise lines such as in middle-latitudes of Northern Hemisphere. By contrast, Argo system contained near global coverage. They demonstrated that the changes in the spatial distribution of the historical observation network introduced an artificial jump during the initiation of the global Argo array (2001–2003). That’s because Ship-based system only sampled regions with faster warming rate pre-2001, and they contains insufficient sampling on regions with moderate warming trend such as Tropical Eastern Pacific and Southern Atlantic.
Considering the sampling bias, ZHU’s team proposed a new method to assess long-term trend in the OHC (0–700 m). New estimates suggest the presence of a continuous upper ocean warming (0.36 ± 0.08 W m-2) since 1966, 20-30% stronger than the existing estimates such as in IPCC-AR5 report.
Relevant work is published in:
Lijing Cheng and Jiang Zhu*, 2014: Artifacts in variations of ocean heat content induced by the observation system changes. Geophysical Research Letters, DOI: 10.1002/2014GL061881

Figure 1. a) Global ocean heat content changes and observation system evolution. The red shaded area shows the amount of bathythermograph (BT) profiles and conductivity, temperature, and depth (CTD) data. The blue shaded area corresponds to the Argo data. b) The main sampling area of Ship-based system; c) The main sampling area of Argo system. d) Regions those were sampled by the Argo-based system in (c), but not in the Ship Area in (b).
