Arctic Sea Ice Decline Intensified Haze Pollution in Eastern China
Date:2014-11-04
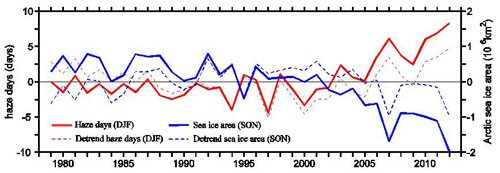
Air quality in eastern China has becoming more and more worrying in recent years, and haze is now No.1 air pollution issue. Here we show the decreasing Arctic sea ice (ASI) is an important contributor to the recent increased haze days in eastern China. We find that the number of winter haze days (WHD) in eastern China is strongly negatively correlated with the preceding autumn ASI during 1979-2012, and about 45-67% of the WHD interannual to interdecadal variability can be explained by ASI variability. Following previous studies on the impact of Arctic sea ice loss on the northern hemisphere climate, we further show that the reduction of autumn Arctic sea ice leads to positive sea-level pressure anomalies in mid-latitude Eurasia, northward shift of track of cyclone activity in China, and weak Rossby wave activity in eastern China south of 40oN during winter season. These atmospheric circulation changes favor less cyclone activity and more stable atmosphere in eastern China, leading to more haze days there. Furthermore, we show that the patterns of circulation changes associated with autumn ASI and WHD are in very good agreement over the East Asia, particularly in eastern China. We suggest that haze pollution may continue to be a serious issue in the near future as the decline of Arctic sea ice continues under global warming.
Citation: Wang, H. J., H.-P. Chen, and J. P. Liu, 2015:Arctic sea ice decline intensified haze pollution in eastern China, Atmos. Oceanic Sci. Lett., 8, 1–9, doi:10.3878/AOSL20140081.
Download: http://159.226.119.58/aosl/EN/abstract/abstract511.shtml

Time series of winter haze day (WHD; in red) and preceding autumn Arctic sea ice extent (ASI; in blue) anomalies, with solid and dashed lines for the original and detrended series respectively. The WHD is defined as the number of site-observed haze days during December-January-February in eastern China south of 40oN (109-122.5 oE, 20-40 oN), and the autumn ASI is the averaged sea ice extent for September-October-November. The anomalies are computed with respect to the period 1981-2010.
