Can human activity affect Pacific Decadal Variability?
Date:2014-12-14
Pacific Decadal Variability (PDV) is one of the most important climate phenomena, and is a key component in the predictability of both regional and global climate change. The positive phase of PDV is characterized by positive sea surface temperature (SST) anomalies in the tropical Pacific and along the west coasts of North and South America, with negative SST anomalies in the central and western North Pacific (Fig. 1a). It is commonly regarded as an internal mode of climate system, which is generated due to the atmosphere-ocean interaction. However, recent studies challenged this opinion and suggested that PDV can be influenced by external forcing (such as human activity, solar variability and volcanic eruptions). Given PDV’s major links with global climate change, its change in a warming world, and the possible mechanism, are of great importance.
Lu Dong, Tianjun Zhou and Xiaolong Chen, from Institute of Atmospheric Physics (IAP/CAS), explored the contributions of internal variability and external forcing in driving the magnitude and evolution of PDV during the twentieth century by analyzing 129 Coupled Model Intercomparison Project Phase 5 (CMIP5) model realizations. They found that PDV phase transition is dominated by internal variability (Fig. 1b), but it is also significantly affected by external forcing, especially the human activity including the emissions of greenhouse gases (GHGs) and anthropogenic aerosols (AAs) (Figs. 1c and d). The GHGs induce the increased surface downward longwave radiation, especially over the tropical Pacific, and results in stronger warming in that area. The AAs result in a stronger cooling in the North Pacific region, due to the reduced surface downward shortwave radiation via cloud–aerosol interaction: this offsets the substantial warming caused by GHGs forcing. As a result, the human activity (combined effects of GHGs and AAs) leads to a positive PDV-like pattern and favors the positive phase of PDV.
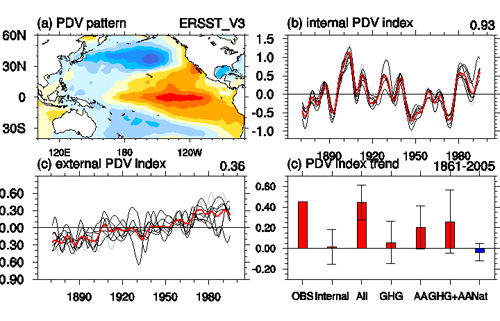
Fig. 1 (a) The pattern of PDV in observation during 1861-2010. Time series of PDV index (in K) from (b) internal variability and (c) external forcing. The grey lines represent the multimember average for each model, and the red line represents the multi-model ensemble (MME). The number at the top right denotes the correlation coefficient between MME and the observation. (d) The linear trends of PDV index during 1861–2005 in observation, internal variability, external forcing, GHG forcing, AA forcing, both GHG and AA forcing, and natural forcing. The error bars denote the standard deviation of inter-model variability. Units: K (100 years)?1
The finding is recently published online in Geophysical Research Letters.
Reference:
Dong Lu, Tianjun Zhou*, and Xiaolong Chen, 2014: Changes of Pacific Decadal Variability in the Twentieth Century Driven by Internal Variability, Greenhouse Gases and Aerosols. Geophys. Res. Lett., 41, doi:10.1002/2014GL062269
Download: http://onlinelibrary.wiley.com/doi/10.1002/2014GL062269/full
Key words: Air/sea interactions, Climate variability, Decadal ocean variability, Global climate models
Contact: ZHOU Tianjun, zhoutj@lasg.iap.ac.cn