Precipitation changes in wet and dry seasons simulated by two versions of the FGOALS model
Date:2015-01-22
Precipitation has a strong seasonal dependence because of the strong cycle of the atmospheric circulation. The wet (dry) season is an annually recurring period with maximum (minimum) precipitation amount. In fact, the timings of the wet and dry seasons are strongly dependent on geographic location. In addition, the wet and dry seasons could shift under global warming. However, most previous studies focused on the fixedly seasonal precipitation, studies on the changes of precipitation in wet and dry seasons remain quite limited. Especially, climate system models play an instrumental role in the projection of the future changes of precipitation and therefore it is essential to know how well the performances of FGOALS, a Flexible Global Ocean–Atmosphere–Land System model developed in Institute of Atmospheric Physics (IAP/CAS), are in the simulation of the timing of wet and dry seasons and corresponding precipitation change during the past century.
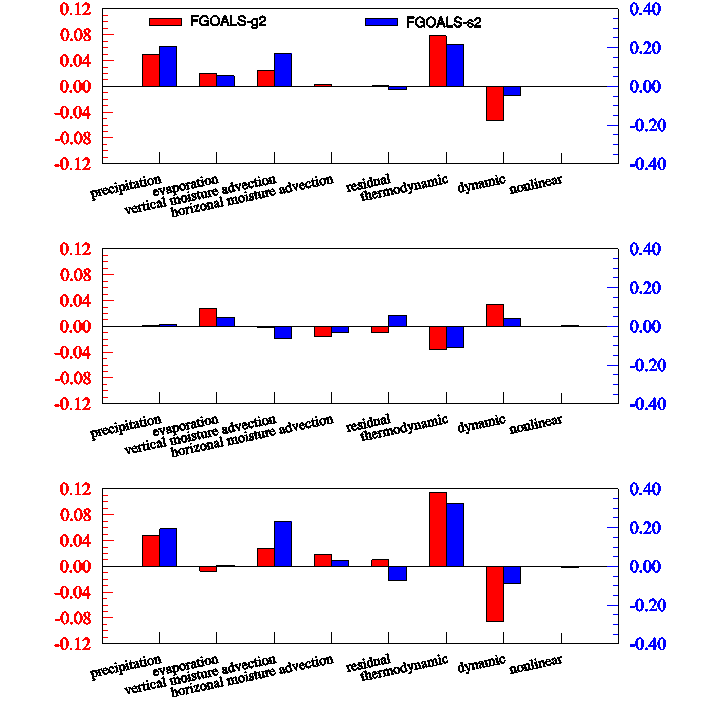
MA Shuangmei and ZHOU Tianjun, from IAP/CAS, evaluated systematically the performance of the LASG/IAP climate system model FGOALS-g2 and FGOALS-s2 in the simulation of the mean state of the timing of the wet and dry seasons and related precipitation amount, then analyzed the long-term trend of wet-/dry-season precipitation during the 20th century. Both models not only reproduce reasonably the mean-state features of the timings of the wet and dry seasons and related precipitation amount (Fig. 1), but also reproduce reasonably the wetter wet season and enhanced annual range of precipitation (Fig. 2). Based on the moisture budget, the wetter wet seasons come from the combined increasing of evaporation and vertical moisture advection. In dry seasons, the increase of evaporation is offset by the reduction of vertical moisture advection, finally leading to an unobvious change in precipitation. The enhanced annual range of precipitation is mainly by the increase of vertical moisture and dominated by the thermodynamic (Fig. 2).
The finding is recently published in Advances in Atmospheric Sciences.

Fig. 1. Timing of the (a, c, e) climatological wet season and (b, d, f) dry season from (a, b) observations, (c, d) FGOALS-g2 and (e, f) FGOALS-s2. The numbers 1 to 12 in the color bar indicate the time that the wet and dry seasons occur, 1: DJF (Dec–Feb); 2: JFM (Jan–Mar); 3: FMA (Feb–Apr); 4: MAM (Mar–May); 5: AMJ (Apr–Jun); 6: MJJ (May–Jul); 7: JJA (Jun–Aug); 8: JAS (Jul–Sep); 9: ASO (Aug–Oct); 10: SON (Sep–Nov); 11: OND (Oct–Dec); 12: NDJ (Nov–Jan).

Fig. 2. The long-term trends (units: mm d?1 (156 yr)?1) of globally averaged moisture budget terms in the (a) wet season, (b) dry season, and (c) annual range. Red (blue) coloring and the left (right) axis corresponds to FGOALS-g2 (FGOALS-s2).
Reference: Ma, S. M., and T. J. Zhou, 2015: Precipitation changes in wet and dry seasons over the 20th century simulated by two versions of the FGOALS model. Adv. Atmos. Sci., 32(6), doi: 10.1007/s00376-014-4136-x.
Download: http://159.226.119.58/aas/EN/abstract/abstract2601.shtml
Contact: Dr. ZHOU Tianjun, zhoutj@lasg.iap.ac.cn
