New Study Reveals the Atmospheric Footprint of the Global Warming Hiatus
Date:2017-02-27

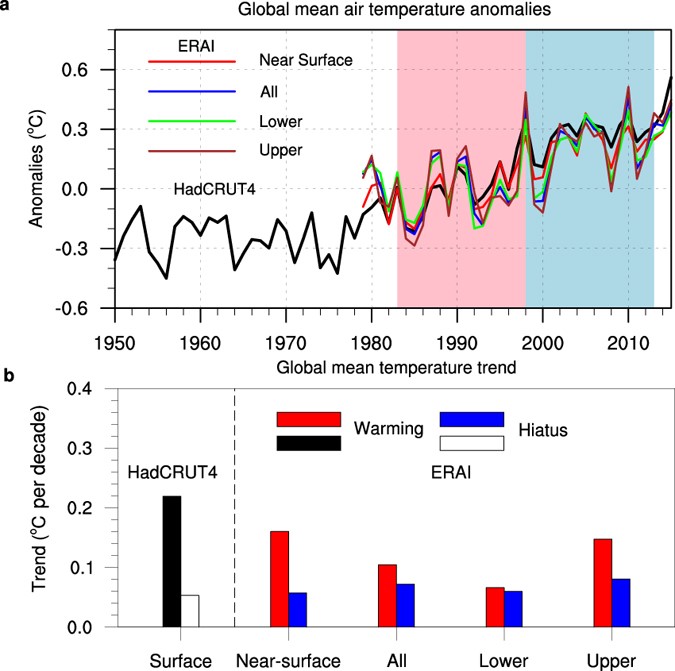
Figure 1. (a) Global mean temperature anomalies from 1950 to 2015 and (b) linear trends of global mean temperature for near surface (i.e. the lowest atmospheric layer), and the vertical average of the whole (surface to 100hPa), lower (surface to 500hPa), and upper troposphere (500hPa to 100hPa). Red (black) bars are for the warming period. Blue(white) bars are for the hiatus period. (Liu and Zhou, 2017)
As to why the surface latent heat flux, atmospheric dynamics and cloud-related processes showed such large differences between 1983-1998 and 1998-2013, LIU, the first author of the paper, explained, “They are dominated by the Hadley Circulation and Walker Circulation changes associated with the phase transition of Interdecadal Pacific Oscillation (IPO).” According to LIU, the IPO is a robust, recurring pattern of sea surface temperature anomalies at decadal time scale. During a positive phase of IPO, the west Pacific and the mid-latitude North Pacific becomes cooler and the tropical eastern ocean warms, while during a negative phase, the opposite pattern occurs. The IPO has shifted from the positive phase to negative phase since 1998/1999, and this transition has led to the weakening of both Hadley Circulation and Walker Circulation, which served as a hub linking the three processes mentioned above.
