IAP Scientists Unravel Changes of Extreme Temperature and Its Discrepancies among Multiple Datasets
Date:2017-07-13
Extreme air temperature events have significant influences on society and ecosystem, affecting the consumption of electricity and water, and inducing forest fires and crop losses. Hence, the occurrence and change of extreme heat have attracted much attention globally.
According to the World Meteorological Organization (WMO), the period 2001-2010, during which the global mean surface temperature, is the hottest decade since 1850, with increasing by 0.88℃ than that of 1901-1910. This warming trend inflames the hot extreme events, resulting in an increase of morbidity and mortality, and the casualty rate caused by extreme heat is highest in all kinds of meteorological disasters. Based on statistics from WMO, during the most recent decade (2001-2010), the number of deaths due to heat waves (136,000) increased markedly (by 2300%) compared to the number (6000) in the decade before (1991-2000). Besides, the changes of hot extreme events exhibit regional characteristics significantly since it belongs to small probability events, and the analysis is sensitive to the choice of datasets.

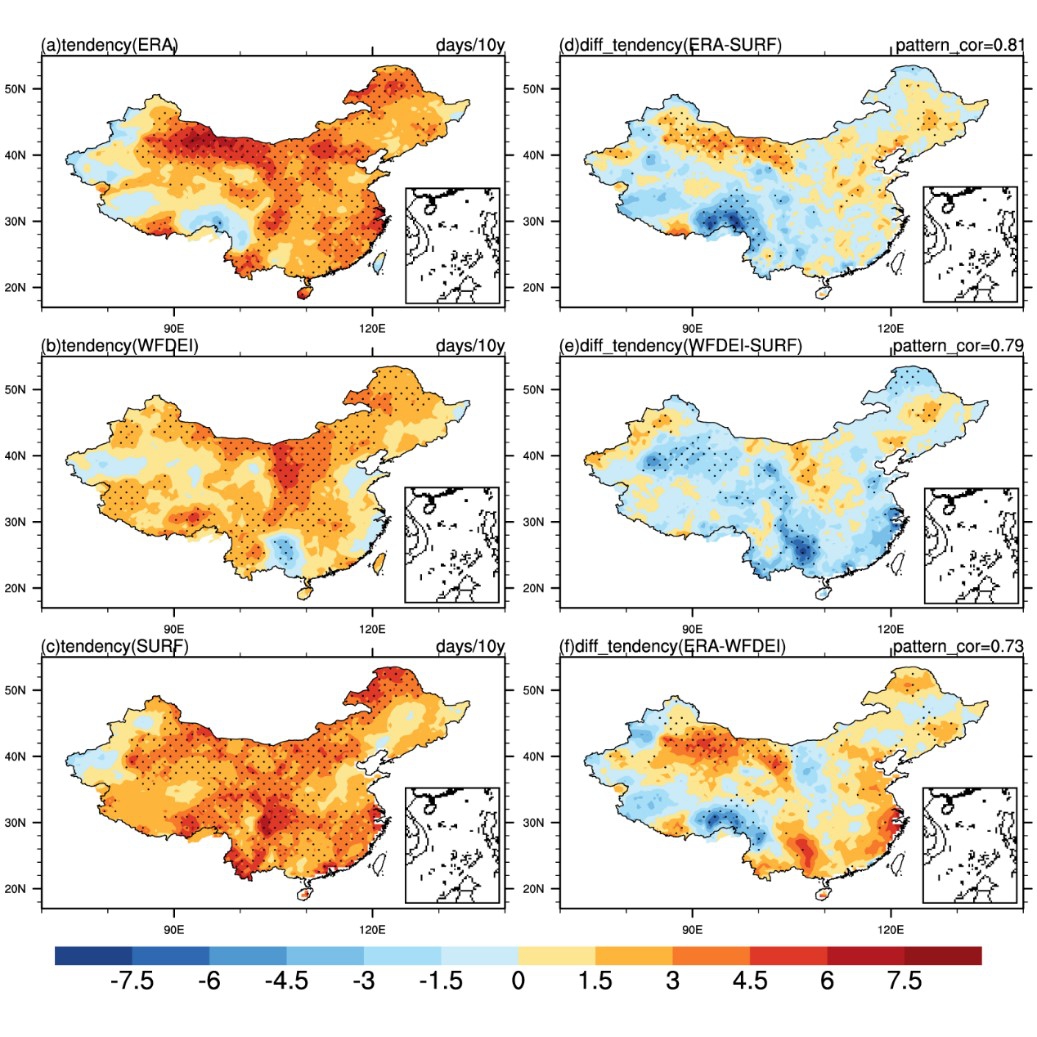
The trend of number of hot day based on percentile threshold derived from (a) ERA-Interim, (b) WFDEI, and (c) SURF, and trend of difference time series between (d) ERA-Interim and SURF, (e) WFDEI and SURF, (f) ERA-Interim and WFDEI. The point signs indicate grids exceed the 95% significance level. (Image by IAP)
Recently, a PhD student HU Lisuo, Professor HUANG Gang, associate professor QU Xia and HU Kaiming, from Institute of Atmospheric Physics, Chinese Academy of Sciences, have investigated the changes of extreme air temperature and its discrepancies between multiple datasets (including observation and reanalysis datasets) based on two indices: absolute and percentile threshold. They point out that hot extreme temperature shows an increasing trend throughout China with spatial and temporal non-uniformity. Although the patterns of climatological distribution and tendency are consistent, there exist discrepancies in detail among different datasets, especially in mid-west China. Since biases are found in the records of daily maximum air temperature between datasets, it is better to adopt percentile index than threshold index to analyze the extreme heat.
Studies above have been published in Theoretical and Applied Climatology.
Reference:
Hu,L., G. Huang* and X. Qu, 2017: Spatialand temporal features of summer extreme temperature over China during 1960-2013,Theoretical and Applied Climatology, 128(3): 821–833, DOI:10.1007/s00704-016-1741-x https://link.springer.com/article/10.1007%2Fs00704-016-1741-x
Hu, L., G.Huang* and K. Hu, 2017: The performance of multiple datasets incharacterizing the changes of extreme temperature over China during 1979 to 2012, Theoretical and Applied Climatology,DOI: 10.1007/s00704-017-2215-5 https://link.springer.com/article/10.1007/s00704-017-2215-5
Contact: Huang Gang, hg@mail.iap.ac.cn
