A New Study of Ocean Salinity Finds Substantial Amplification of the Global Water Cycle
Date:2020-09-09
Water and its movements within or between atmosphere, land, and ocean define the global water cycle and is central to the climate system (Figure 1). Almost all weather and climate phenomena are in some way tied to the water cycle. Examples include extreme rainfall during thunderstorms, hurricanes and tropical cyclones, flooding, droughts, and sea level rise.
Now the water cycle is changing in important ways, as the climate changes. Theory and models suggest that as the Earth is warming, the global water cycle amplifies, i.e., more water is evaporated from the ocean, and consequently precipitation is increasing as well. Yet the observational confirmation of this prediction has been difficult, since past changes of the water cycle are were poorly observed due to the difficulty of measuring global-scale evaporation and precipitation and the complexity of their spatial and temporal variability.
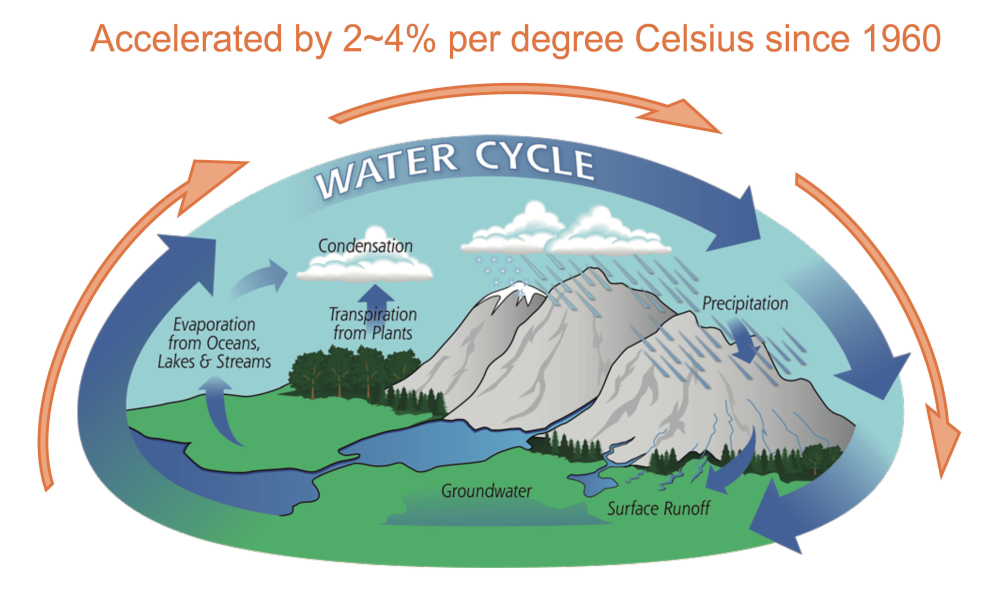
Figure 1. An illustration of global water cycle and its change. Figure adapted from https://gpm.nasa.gov/education/water-cycle
The new study, published in Journal of Climate, overcomes many of the previous limitations, and derives a new estimate of water cycle change based on a new salinity data product since 1960. From this, they provided new strong evidence that the global water cycle has amplified substantially in the past 50 years, confirming theory and models. The study is led by CHENG Lijing from the Institute of Atmospheric at the Chinese Academy of Sciences, who collaborated with a group of international scientists from National Center for Atmospheric Research, U.S.; ETH Zurich; University of St. Thomas, U.S.; Pennsylvania State University, U.S.
"Ocean salinity change can be used to estimate water cycle change, because it reveals the modification of global surface freshwater exchanges: evaporation takes freshwater from the ocean into the atmosphere and increases the ocean salinity; precipitation puts more freshwater into the ocean and reduces the salinity. Consequently, salinity changes integrate effects over broad areas and provide an excellent indicator for water cycle change." CHENG introduced.
"However, as previous salinity datasets show severe biases or shortcomings, we thereby need better salinity data. This study provides new monthly gridded salinity fields for the upper 2000 m since 1960." John ABRAHAM said, "To perform interpolation across data sparse intervals and regions, the method uses information on the spatio-temporal co-variability of salinity taken from the historical coupled climate model simulations. The method is then rigorously verified."
"The new product is clearly more reliable for examining long-term salinity changes, as we show that this new salinity reconstruction has much better continuity through changes in the observing-system (from altimeters on satellites and profiling floats (Argo) in the ocean." a co-author, Kevin TRENBERTH from NCAR said: "The new data demonstrate that the existing salinity pattern has amplified. In other words, ‘the fresh gets fresher, and the salty gets saltier’ in much of the ocean (Figure 2). Also, we show, for the first time, that the ocean 0-2000m averaged salinity trend indicates freshening in almost the entire Pacific Ocean, broad salinification in the low- and middle-latitudes Atlantic, pronounced freshening in North Atlantic, and contrasts between the north and south Indian ocean." (Figure 2)
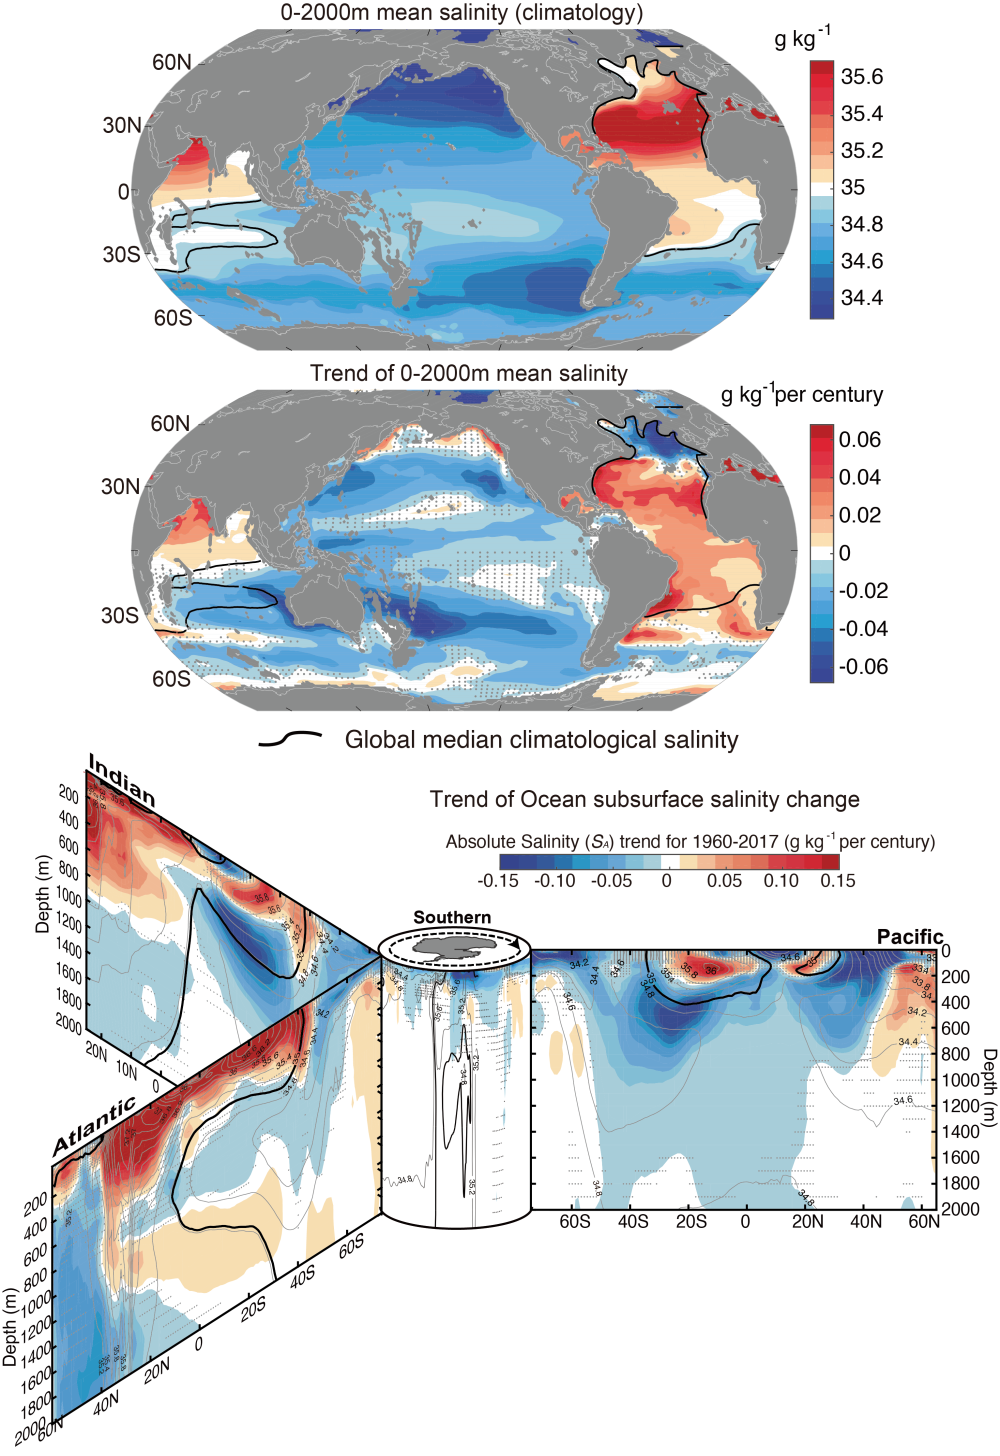
Figure 2. 0-2000 mean salinity climatology (top) shows the relatively fresh Pacific versus the salty Atlantic northern Indian Ocean. Its long-term trend (middle) has a remarkably similar pattern. The zonal mean ocean salinity trends (bottom) since 1960 in each ocean basin, organized around the Southern Ocean in the center, depict the penetration of surface anomalies into the ocean subsurface. (Image by CHENG Lijing)
The salinity change is spatially complicated, this study uses a simple index to synthesize these changes, named the Salinity Contrast (SC) index, which is defined as the difference between the salinity averaged over high-salinity and low-salinity regions (Figure 3). "This metric provides a simple but powerful means of synthesizing the observed salinity pattern changes." said Nicolas GRUBER, a coauthor of this study from ETH: "we show that 0-2000m salinity pattern has amplified by 1.6% and surface salinity has amplified by 7.5%. We also show that this increase is due to human influence, and this anthropogenic signal has exceeded the natural background variability."
An improved estimate of the global water cycle change has been compiled based on the new salinity data, salinity-contrast metrics and model simulations. It shows that the water cycle has been already amplified by 2-4 % per degree Celsius since 1960 (Figure 1). "Our ocean-based result is broadly consistent with many recent atmospheric based estimates and strengthens the evidence that the global water cycle has been intensified with global warming." Said by John FASULLO from NCAR, U.S.
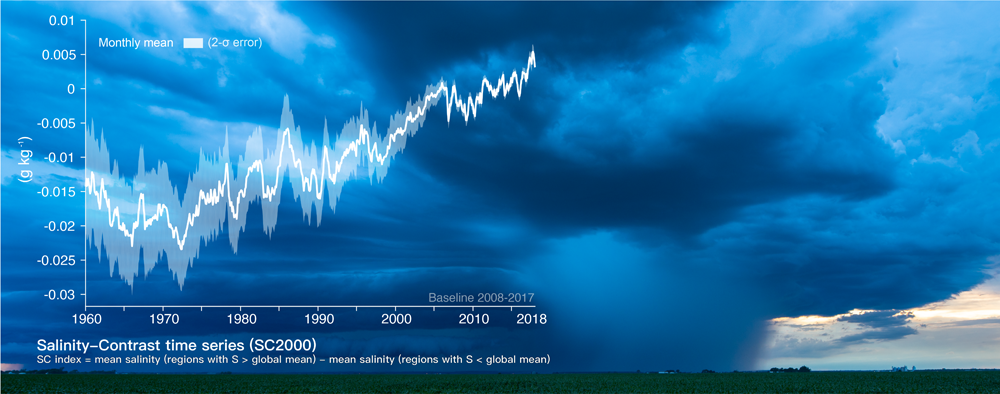
Figure 3. Increasing salinity-contrast in the world's ocean. Figure shows Salinity-contrast time series from 1960 to 2017 at upper 2000m. Background Photograph: WANG Xilin.
This result has important implications for the future climate. In a world warmed by +2°C (the upper limit of the "Paris Agreement" target), the water cycle will amplify by 4-8%. This amplification will be even stronger if the aerosol impacts are smaller in the future than today (i.e. if the air pollution can be controlled). Consequently, there will be stronger evaporation: the drier regions will get even drier and further increase the odds of worsening drought. Droughts affect livestock and crops and increase risk of damaging and sometimes deadly wildfire in many regions, including the U.S., China, Australia, Brazil, and other countries, posing severe risks to food safety and human health. There will also be greatly increased risk of heavy and extreme rains. The more intense rainstorms cause major problems like extreme flooding around the world. The rainfall associated with tropical cyclones and hurricanes will continue to grow and increase damage not only to coastal and small island communities, but well inland as well (as in Isaias).
Long-term ocean salinity change: Grand Pacific freshening and Atlantic salinitication (Animation by Ocean Data Center, Center for Ocean Mega-Science, Chinese Academy of Sciences)
"This study is a significant advance in the field", said Michael MANN from Pennsylvania State University, U.S. "First, the new, more accurate estimates of salinity changes provide a better basis for comparison with climate model simulations. Secondly, the Salinity-Contrast index provides a key measure of climate change impact on the global water hydrological cycle and helps distinguish the signal. We find that it takes a little more than a decade to isolate the climate change signal from background noise in this particular metric, suggesting it should be used more widely by the climate research community."
This study is supported by National Key R&D Program of China (2017YFA0603202), Key Deployment Project of Centre for Ocean Mega-Research of Science, CAS (COMS2019Q01), European Union’s Horizon 2020 research and innovation programme under grant agreements 821001 and 821003.
Reference:
Cheng L., K. E. Trenberth, N. Gruber, J. P. Abraham, J. Fasullo, G. Li, M. E. Mann, X. Zhao, Jiang Zhu, 2020: Improved estimates of changes in upper ocean salinity and the hydrological cycle. Journal of Climate. In press, doi: https://doi.org/10.1175/JCLI-D-20-0366.1.