AI Framework Pinpoints Global Drivers of Extreme Heatwaves

Date:2026-04-18    

As the climate warms, extreme events such as heatwaves, heavy rainfall and droughts are becoming more frequent, more extensive and more damaging. For scientists, the key question is no longer only whether these events will intensify in a warmer world. An equally important and more difficult question is why a particular event occurred, how it evolved, and which regions and physical processes were most responsible for driving it.

Answering that question matters for more than basic science. It is also essential for improving early warning, impact assessment and climate adaptation.

For decades, statistical methods have played a central role in identifying the large-scale background factors associated with extreme events. Sea-surface temperature anomalies, land-atmosphere feedbacks and dominant circulation modes can often be linked to extremes through robust statistical relationships. But the dynamics of a single real-world event are usually far more complex. Local processes and remote teleconnections often act together, and their effects are frequently nonlinear. As a result, conventional statistical approaches can identify broad background influences, yet they often struggle to answer a more event-specific question: which regions mattered most, at which stage of the event, and by how much?

From a dynamical perspective, sensitivity experiments based on numerical models provide a more direct route. Their logic is closely related to that of Green’s function experiments. In simple terms, a Green’s function experiment works like this: a scientist introduces a small change (anomaly) in one specific region—for example, warmer sea surface temperatures over the North Atlantic—then runs a model to see how that single change affects an extreme event elsewhere, such as a heatwave in South China. By repeating this for many regions, researchers can map out which parts of the world have the biggest influence on the event. Traditionally, this requires thousands of expensive simulations. In practice, however, applying this idea on a global scale has long been prohibitively expensive.

A multi-institution international team led by the Institute of Atmospheric Physics at the Chinese Academy of Sciences has now developed a way around that bottleneck. Published in Geophysical Research Letters, the researchers present a sensitivity reforecast framework based on an AI weather forecasting model, designed to diagnose extreme events rapidly and quantitatively. The method takes advantage of the speed and stability of AI-based weather prediction to perform systematic, region-by-region, Green’s-function-like experiments for a specific event. By selectively removing or preserving initial anomalies over different parts of the globe, and then tracking the resulting forecast changes and shifts in forecast skill, the framework identifies the regions that most strongly influence the onset, evolution and intensification of an extreme event.

The approach offers two clear advantages. First, it provides a way to identify key impact regions on a global scale and to quantify how much different regions contribute to the development of an event. Second, because the analysis is embedded in a forecasting framework, the diagnosis is tied directly to the event’s dynamical evolution. This gives the results stronger causal interpretability than methods based only on statistical association or local model sensitivity.

To demonstrate the framework, the team examined the record-breaking South China heatwave of August 2022. Their results show that the event was not controlled by a single local driver. Instead, it unfolded through a distinct staged and relay-like evolution. In the early phase, nearby regions and local dynamical and thermodynamical processes dominated. In the middle stage, anomalies over Europe exerted a substantial influence on the heatwave’s development. Later, anomalies over North America further amplified the event.

Additional dynamical analysis suggests that signals from Europe and North America propagated eastward through transcontinental wave trains and modulated the large-scale circulation over East Asia. That circulation change then promoted subsidence, drying and reduced cloud cover over South China, creating a positive feedback that helped sustain and intensify the heatwave.

One of the most striking findings is that retaining initial anomalies only over the identified high-impact regions, which together account for roughly one quarter of the globe, was sufficient to reproduce the spatial pattern and temporal evolution of the heatwave with considerable fidelity. By contrast, when anomalies in those key regions were removed, the model struggled to reconstruct the event. This suggests that the framework does more than simply flag potentially relevant regions. It can quantitatively isolate the regions that played a decisive role in the event’s evolution.

The conclusions were further supported by experiments using a second AI weather forecasting model, FuXi, as well as additional tests based on an alternative climate-region partitioning scheme. Taken together, these results suggest that the diagnosed source regions are robust and that the framework is not tied to a single model configuration.

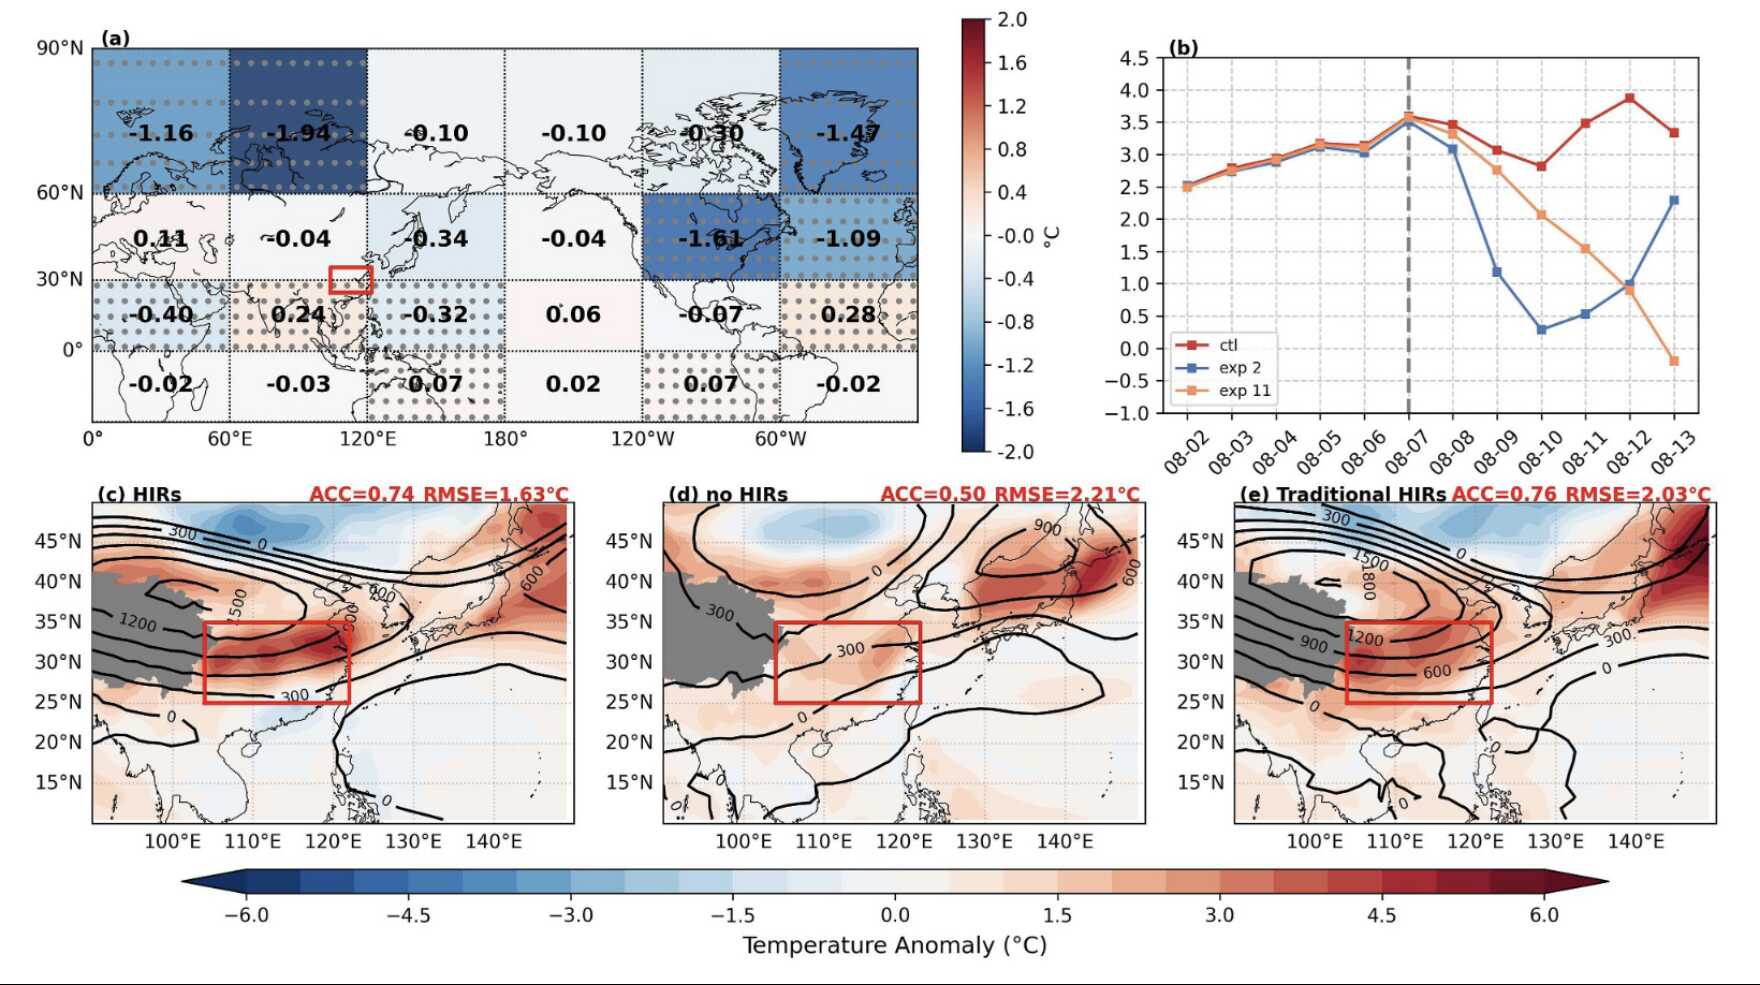
Remote source regions shape the South China heatwave during days 6-11. Forecasts driven only by the identified high-impact regions successfully reproduce the event, whereas removing those regions strongly degrades the prediction. (Image by IAP)

The significance of the study extends well beyond one heatwave. More broadly, it points to a new methodological route for extreme-event research. By bringing Green’s-function-like regional perturbation experiments into an AI forecasting framework, the study shows that it may be possible to move from identifying broad correlations to carrying out fast, event-specific and quantitatively interpretable diagnosis. The method also differs from standard gradient-based AI explainability tools, which often highlight local model sensitivities but do not necessarily map clearly onto the physical and causal structure of an evolving weather event. Here, the diagnosis is based on explicit regional perturbation experiments, which makes the link to event dynamics more direct.

Compared with traditional high-cost sensitivity experiments, the new framework substantially improves diagnostic efficiency while retaining physical interpretability and quantitative power. In that sense, it offers a possible path for moving extreme-event research from correlation-based attribution towards mechanistically constrained, forecast-based diagnosis.

Looking ahead, the researchers suggest that similar frameworks could be extended beyond heatwaves to other high-impact weather and climate extremes. Combined with AI agents and automated analysis pipelines, such approaches may eventually support rapid identification of key source regions, quantitative attribution of event development, and more systematic diagnosis of the physical pathways behind extreme events.

The first author of the study is Xiang Longzhen, a PhD student at the Institute of Atmospheric Physics, Chinese Academy of Sciences. The corresponding authors are Wang Ya and Huang Gang. Co-authors include Lin Pengfei, Tao Weichen and Qu Xia from the Institute of Atmospheric Physics; Robin T. Clark from the UK Met Office; Yang Kai from CSIRO in Australia; Li Xichen from Peking University; and Hu Kaiming from Capital Normal University. The research was supported by the National Natural Science Foundation of China and the Earth System Numerical Simulation Facility.

© 2014- IAP/CAS, All rights reserved.
No. 81 Beichen West Road, Chaoyang District, P. O. Box 9804, Beijing 100029, P. R. China
Tel: +86-10-82995251 Fax: +86-10-82995180 E-mail: iap_en@mail.iap.ac.cn
京ICP备14024088号-6 京公网安备:110402500041