|
|
 |
|
 |
|
Is the Earth warming? The ocean gives you the answer
Humans have released carbon dioxide and other greenhouse gases, and the result is an accumulation of heat in the Earth's climate system, commonly referred to as "global warming". "How fast is the Earth's warming?" is a key question for decision makers, scientists and general public.
Fishermen ply their trade in the Gulf of Mannar in the Indian Ocean near Sri Lanka, one example of the vital importance of oceans to planet Earth and humankind. Measurements of ocean heating and sea level rise could prove more reliable than atmospheric measurements for tracking vital signs for the health of the planet. (Image by ZHU Jiang) Previously, the global mean surface temperature has been widely used as a key metric of global warming. However, a new study published in AGU's Eos proposed a better way of measuring global warming: monitoring ocean heat content change and sea level rise. The authors come from a variety of international communities including China (Institute of Atmospheric Physics, Chinese Academy of Sciences), U.S.A. (NCAR, NOAA, and University of St. Thomas) and France (Mercator Ocean).To determine how fast the Earth is accumulating heat, scientists focus on the Earth's energy imbalance (EEI): the difference between incoming solar radiation and outgoing longwave (thermal) radiation. Increases in the EEI are directly attributable to human activities that increase carbon dioxide and other greenhouse gases in the atmosphere. Extra heat trapped by increasing greenhouse gases mainly ends up in the oceans (more than 90% is stored there). Hence, to measure global warming, we have to measure ocean warming!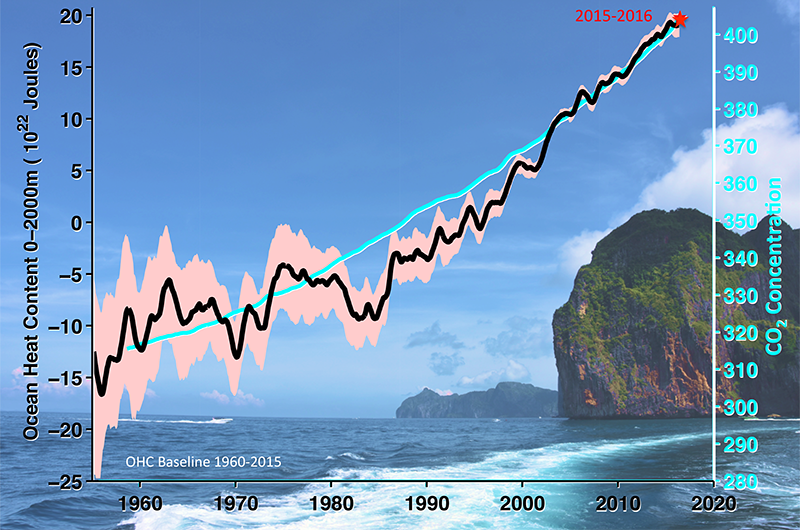
Ocean heat content (OHC) and atmospheric carbon dioxide (CO2) concentration measurements since 1958, shown as 12-month running means. The black line represents ocean heating for the upper 2,000 meters of ocean, and light red shading represents the 95% confidence interval. CO2 concentration observed at Mauna Loa Observatory is displayed by light blue. Mean values for 2015–2016 are highlighted with a red star. The OHC is relative to a 1960–2015 baseline. (Image by CHENG Lijing)On the other hand, the amplitude of the global warming signal compared with natural variability (noise) defines how well a metric tracks global warming. This study shows that the temporal evolution of ocean heat content has relatively high signal-to-noise ratio; therefore, it requires 3.9 years to separate the global warming trend from natural variability. Similarly, for sea level rise, 4.6 years are sufficient to detect the climate change signal. By contrast, owing to weather, El Niño - Southern Oscillation and other natural variability embedded in the global mean surface temperature record, scientists need at least 27 years of data to detect a robust trend. An excellent example is the 1998-2013 period, when energy was redistributed within the Earth's system and the rise of global mean surface temperature slowed - sometimes call a "hiatus".This study suggests that changes in ocean heat content, the dominant component of Earth's energy imbalance, should be a fundamental metric along with sea level rise. Based on the recent improvements of ocean monitoring technologies, especially after 2005 through autonomous floats called Argo, and advanced methodologies to reconstruct the historical ocean temperature record, scientists have been able to quantify ocean heat content changes back to 1960, even though there is a much sparser historical instrument record prior to 2005. Sea level rise is best known since 1993 when altimeters were first launched on satellites to enable sea level change observations to millimeter accuracy.According to the most up-to-date estimates, the top-10 warmest years of the ocean (indicated by OHC change at upper 2000m) are all in the most recent decade after 2006, with 2015-2016 the warmest period among the past 77 years. The heat storage in the ocean amounts to an increase of 30.4×10²² Joules (J) since 1960, equal to a heating rate of 0.33 Watts per square meter (W m-2) averaged over the entire Earth's surface-- and 0.61 W m-2 after 1992. For comparison, the increase in ocean heat content observed since 1992 in the upper 2000 meters is about 2000 times the total net generation of electricity by U.S. utility companies in 2015.It is evident that scientists and modelers who seek global warming signals should track how much heat the ocean has stored at any given time, i.e. ocean heat content, as well as sea level rise. Locally, in the deep tropics, ocean heat content directly relates to hurricane activity. Ocean heat content is a vital sign of our planet and informs societal decisions about adaptation to and mitigation of climate change.Reference: Cheng, L., K. E. Trenberth, J. Fasullo, J. Abraham, T. P. Boyer, K. von Schuckmann, and J. Zhu (2017), Taking the pulse of the planet, Eos, 98, https://doi.org/10.1029/2017EO081839 . Contact: CHENG Lijing, chenglij@mail.iap.ac.cn |
|
|
|
